
The Lafayette Company · Released September 24, 2026
Young American Men Survey 2026
The Lafayette Company surveyed 800 young American men, registered voters ages 18 to 30, six weeks before the midterms. How will they vote and what do their lives look like? Their answers released at the second Symposium on Young American Men.
800
Men surveyed nationwide
Registered voters aged 18 to 30
55%
of young men say their life is on track
40% say it is off track
43%
of young men say the rules in this country are set against men like them
47% say the rules work for them
63%
of young men want the federal government doing more about the problems facing young men
Including 67% of those who would vote Republican
Fielded by Cygnal, September 15–18, 2026 · margin of error ±3.46% · population Registered voters, men aged 18–30 in the United States
What we found
Six topline numbers
Click “the question” to dive deeper.
- 57–40Democratic lead among young men most determined to vote
Republican support increases among men who probably will not turn out.
Heading into the November midterms, Democrats hold a 17-point lead (D+17) on the generic ballot among the likely voting electorate of young men age 18-30. Overall, it lands at 44% Democrat to 41% Republican. The Republican share of these men is real, but badly distributed and concentrated among those history says will stay home.
The question - 55%of young men say their life is on track
The men more likely to vote are more likely to say their life is on track
55% of young men say their life is on track and 40% say it is off track. Among young men who are motivated to vote in November, 59% say on track and 38% say off track. Among young men who are not motivated to vote, it is even: 46% say on track and 46% say off track.
The question - 63%of young men want the federal government doing more
Inflation is the top vote driver
63% of young men want the federal government doing more about the problems facing young men. Inflation is the top vote driver at 29%, rising to 35% among men certain to vote, with housing second at 14%. Trump 2024 voters who aren’t voting Republican say the same thing in the open ends, citing broken promises and nothing delivered rather than any ideological break.
The question - 46%of young men have belonged to a group that made a real difference in their life
Most commonly a religious group, sports team, or jobs
46% of young men have belonged to an organization that made a real difference in their life. Organizational belonging predicts other kinds of thriving. Men who belong are more likely to be on a career track (59% vs. 41% of non-members), to have a mentor (70% vs. 39%) and to be highly determined to vote (52% vs. 38%).
The question - 43%of young men say the rules are set against men like them
This number is true across both parties
43% of young men say the rules in this country are set up to hurt young men like them. 47% of young men say the rules work for them. Each party draws 43% of its support from young men who say the rules are against them. Of the young men who say the rules are against them, 28% are certain to vote; of those who say the rules work for them, 40% are certain.
The question - 25%of young men say they want to get married but do not see it happening for them
A slightly higher percentage want to get married and are confident they will
The doubtful group is more single (81% against 65% overall) and likelier to be off track (45%). 39% think the country sees young men as worth investing in (versus 55% of the confident group), and 24% want a mentor they do not have (11% of confident men).
The question
The ballot
A 17-point Democratic lead among the men most determined to vote, a 13-point Republican lead among the men who are not
Democrats lead 57 to 40 on the generic ballot among the young men most determined to vote. The men in the middle split almost evenly, 47 Republican to 45 Democratic. Republicans lead 39 to 26 among the 28% who are not likely to vote at all.
These are young men aged 18 to 30. The first three charts below break them down into groups based on how determined they say they are to vote. The last chart shows responses from everyone, including those who are not likely to vote.
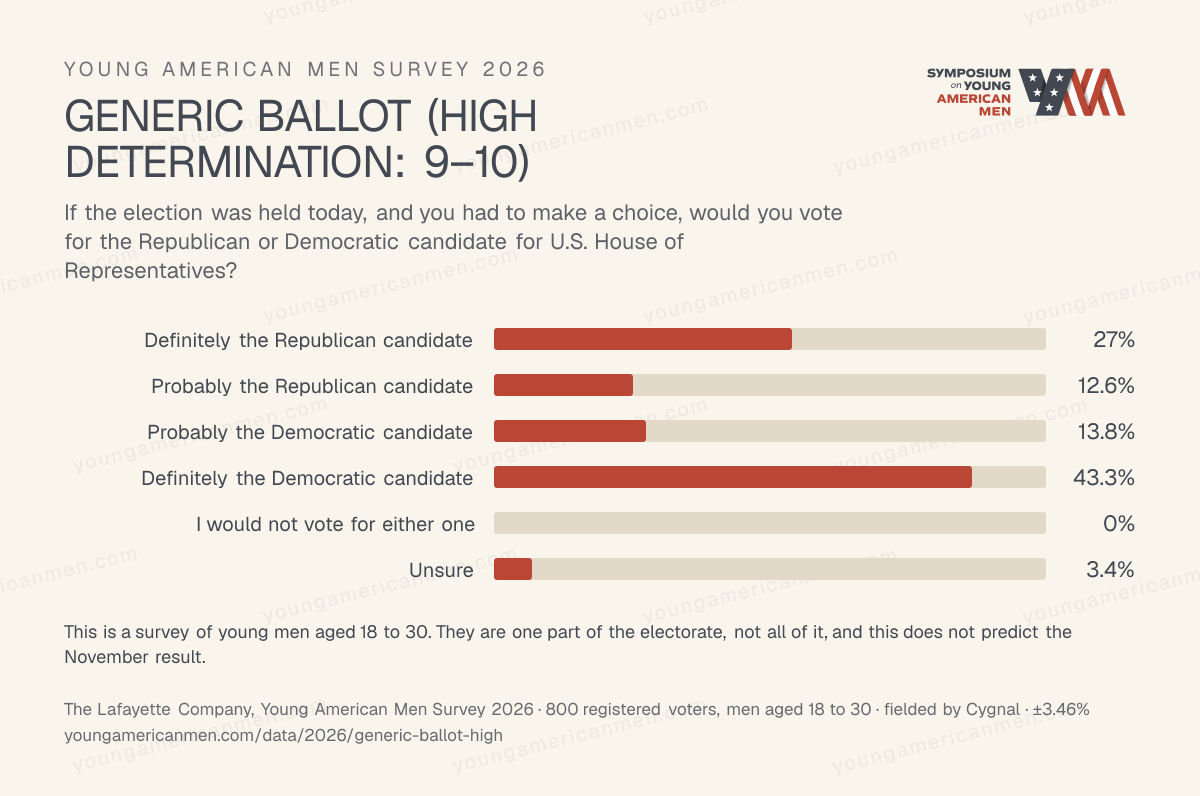
The 41% most determined to vote, 9 or 10 out of 10
If the election was held today, and you had to make a choice, would you vote for the Republican or Democratic candidate for U.S. House of Representatives?
The 41% of young men who rate their determination to vote 9 or 10 out of 10. Cygnal calls this group the likely voting electorate.
- Definitely the Democratic candidate 43.3%
- Probably the Democratic candidate 13.8%
- I would not vote for either one 0%
- Unsure 3.4%
- Probably the Republican candidate 12.6%
- Definitely the Republican candidate 27%
The 28% in the middle, 6 to 8 out of 10
If the election was held today, and you had to make a choice, would you vote for the Republican or Democratic candidate for U.S. House of Representatives?
The 28% of young men who rate their determination to vote 6, 7 or 8 out of 10.
- Definitely the Democratic candidate 22.5%
- Probably the Democratic candidate 22.6%
- I would not vote for either one 0%
- Unsure 8.1%
- Probably the Republican candidate 25.5%
- Definitely the Republican candidate 21.3%
The 28% not likely to vote, 5 or below out of 10
If you did end up voting this November, would you vote for the Republican or Democratic candidate for U.S. House of Representatives?
The 28% of young men who rate their determination to vote 5 or below. They were asked who they would pick if they voted anyway.
- Definitely the Democratic candidate 7.4%
- Probably the Democratic candidate 19%
- I would not vote for either one 16.5%
- Unsure 18.3%
- Probably the Republican candidate 24.2%
- Definitely the Republican candidate 14.7%
Everyone
The three determination groups combined: every young man's answer to whichever version of the ballot question he was asked.
- Definitely the Democratic candidate 26.5%
- Probably the Democratic candidate 17.5%
- I would not vote for either one 5.1%
- Unsure 10.3%
- Probably the Republican candidate 19.2%
- Definitely the Republican candidate 21.5%
Image tests
Among all young men, nobody tested is liked
Net favorability is the share of young men with a favorable opinion minus the share with an unfavorable one. All four are under water with young men as a whole. Among the likely voting electorate, the young men most determined to vote, the gap widens for three of them and reverses for the Democratic Party.
- Donald Trump-17.5among all young men-19among the likely voting electorateAll young men: 37.8% favorable, 55.3% unfavorable
- JD Vance-9.8among all young men-15among the likely voting electorateAll young men: 37.0% favorable, 46.8% unfavorable
- The Republican Party-8.3among all young men-12among the likely voting electorateAll young men: 40.2% favorable, 48.6% unfavorable
- The Democratic Party-1.2among all young men+14among the likely voting electorateAll young men: 44.0% favorable, 45.2% unfavorable
The charts on each question page are all young men. The likely-voting-electorate figures come from the survey’s own analysis and are given to the whole number.
Where do you stand?
Answer six of the questions we asked
After each answer you see how 800 young American men answered, with yours marked. Nothing is saved.
Question 1 of 6
Thinking about where you are in life right now, would you say your life is on track or off track?
Three kinds of young men
Two engaged groups and one that has checked out
The survey's segmentation analysis sorts the sample into three groups. The share is of all 800 men. The figures are within each group.
- 42%
Trump-aligned Republicans
The most institutionally anchored group in the survey.
- 92%Republican on the generic ballot
- 72%voted Trump in 2024
- 64%say life is on track
- 58%have a mentor
- 51%say the rules work for someone like them
- 67%still want government doing more
Republican, conservative, suburban, lower to middle income, white, non-college.
- 10%
Checked-out nonvoters
No formed politics at all, and the detachment is social as much as political.
- 84%hold no ballot preference
- 47%did not vote in 2024
- 48%have nowhere they spend time around other men
- 24%report no close male friendships
- 28%are not working
- 35%do not look for faith anywhere
Independent, younger (35% are 18 to 21), lower income (60% under $50k), more racially diverse, non-college.
- 47%
Democratic young men
The most politically engaged group, and the least confident about their own lives.
- 87%Democratic on the generic ballot
- 40%certain to vote, the highest of any group
- 52%say life is on track, 47% off track
- 20%name mental health as their top priority
- 32%say children are not something they plan on
- 67%want government doing more
Liberal, suburban, lower to middle income, college educated.
Every question
All 39 questions
Grouped by theme. Each question has its own page: the breakdown, the table, a PNG and an embed.
Politics13 questions
Election Determination
On a scale of 0 to 10, how determined are you to vote in the November 3rd general election for U.S. House of Representatives and other state offices, with 0 meaning not determined at all and 10 meaning extremely determined?
- 0, not determined at all7.1%
- 11.9%
- 21.1%
- 32.9%
- 43.1%
- 511.6%
- 66.6%
- 79.4%
- 812.3%
- 97.5%
- 10, extremely determined33.2%
- Unsure3.3%
Generic Ballot (High Determination: 9–10)
If the election was held today, and you had to make a choice, would you vote for the Republican or Democratic candidate for U.S. House of Representatives?
- Definitely the Republican candidate27%
- Probably the Republican candidate12.6%
- Probably the Democratic candidate13.8%
- Definitely the Democratic candidate43.3%
- I would not vote for either one0%
- Unsure3.4%
Generic Ballot (Mid Determination: 6–8)
If the election was held today, and you had to make a choice, would you vote for the Republican or Democratic candidate for U.S. House of Representatives?
- Definitely the Republican candidate21.3%
- Probably the Republican candidate25.5%
- Probably the Democratic candidate22.6%
- Definitely the Democratic candidate22.5%
- I would not vote for either one0%
- Unsure8.1%
Generic Ballot (Low Determination: 0–5)
If you did end up voting this November, would you vote for the Republican or Democratic candidate for U.S. House of Representatives?
- Definitely the Republican candidate14.7%
- Probably the Republican candidate24.2%
- Probably the Democratic candidate19%
- Definitely the Democratic candidate7.4%
- I would not vote for either one16.5%
- Unsure18.3%
Combined Generic Ballot
The three determination groups combined: every young man's answer to whichever version of the ballot question he was asked.
- Definitely the Republican candidate21.5%
- Probably the Republican candidate19.2%
- Probably the Democratic candidate17.5%
- Definitely the Democratic candidate26.5%
- I would not vote for either one5.1%
- Unsure10.3%
Image: Donald Trump
Do you have a favorable or unfavorable opinion of Donald Trump?
- Very favorable20.3%
- Somewhat favorable17.4%
- Somewhat unfavorable12.2%
- Very unfavorable43.1%
- No opinion6%
- Never heard of1%
Image: JD Vance
Do you have a favorable or unfavorable opinion of JD Vance?
- Very favorable15.8%
- Somewhat favorable21.2%
- Somewhat unfavorable14.8%
- Very unfavorable32.1%
- No opinion11.8%
- Never heard of4.4%
Image: The Republican Party
Do you have a favorable or unfavorable opinion of The Republican Party?
- Very favorable19.6%
- Somewhat favorable20.6%
- Somewhat unfavorable17.2%
- Very unfavorable31.3%
- No opinion9.4%
- Never heard of1.8%
Image: The Democratic Party
Do you have a favorable or unfavorable opinion of The Democratic Party?
- Very favorable19%
- Somewhat favorable25%
- Somewhat unfavorable21.7%
- Very unfavorable23.5%
- No opinion8.5%
- Never heard of2.3%
Policy Direction Impact
Which of the following would make the biggest difference in your own life? Select up to TWO options.
- Lowering the cost of groceries and everyday goods38.4%
- Making housing cheaper to rent or buy31.9%
- Tax cuts for people at my income level19.4%
- Better access to mental health care18.1%
- More entry-level jobs that do not require a degree17.9%
- Cutting the cost of a college degree or canceling student debt16.5%
- More support for young fathers and young families15.5%
- Paid apprenticeships and training for skilled trades15.1%
- None of these would make a difference3%
- Unsure4.5%
Vote Driver
Which one of the following will matter most in deciding how you vote this November?
- Inflation and the cost of living28.9%
- Housing costs and being able to afford a place to live13.9%
- Immigration9.5%
- Jobs and the entry-level job market8.6%
- Health care costs8.2%
- Crime and public safety6.6%
- The war in Iran6.5%
- Tariffs and trade5.8%
- Student loans and the cost of college4.1%
- Unsure8%
Government Role
How much, if anything, should the federal government be doing about the problems facing young men in America today?
- A great deal more than it is doing now35.1%
- Somewhat more than it is doing now28.2%
- About what it is doing now17.6%
- Less than it is doing now6.5%
- Nothing at all4.1%
- Unsure8.6%
2024 Retro Ballot
Thinking back, who did you vote for in the 2024 election for President?
- Republican Donald Trump37.2%
- Democrat Kamala Harris32.7%
- Another candidate5.8%
- Did not vote in 202420.3%
- Unsure4%
Life & work8 questions
Life On Track
Thinking about where you are in life right now, would you say your life is on track or off track?
- Definitely on track13.9%
- Mostly on track40.9%
- Mostly off track22.6%
- Definitely off track17.2%
- Unsure5.4%
Young Men Priority
Thinking about your own life right now, which one of the following is the most important thing for you to get right?
- Earning enough to cover my costs20.8%
- My mental health16.9%
- My physical health13.7%
- Affording a place of my own11.5%
- Finding or keeping career-track work8.9%
- Faith or a sense of purpose7.7%
- Friendships and community6.1%
- Paying down student loans or other debt5%
- Finding a long-term relationship4.7%
- Unsure4.8%
Work Situation
Which of the following best describes your work situation right now?
- I have a job I consider the start of a career29.7%
- I have a job that pays the bills but is not a career25%
- I am in an apprenticeship or training for a skilled trade8.1%
- I am working for myself or building my own business10.6%
- I am in school or training full time and not working6.6%
- I am not working and looking for work13%
- I am not working and not looking for work3.7%
- Unsure3.2%
Living Arrangement
Which of the following best describes where you live right now?
- On my own or with roommates, paying my own way29.2%
- With a spouse or partner24.8%
- With my parents or other family32.8%
- In campus or university housing4.9%
- In military housing or barracks2.4%
- Something else3.9%
- Unsure2%
Economic Control
How much control do you feel you have over your own financial future?
- A great deal of control33.9%
- Some control37.9%
- Not much control18.9%
- No control at all6.3%
- Unsure3%
Job Prospects
In your own experience, does being a man help you, hurt you, or make no difference when you are looking for work?
- It helps me a lot16%
- It helps me a little21.1%
- It hurts me a little13.9%
- It hurts me a lot5.2%
- It makes no difference36.8%
- Unsure7%
Out Of Place Fields
In which of the following fields, if any, would you personally feel out of place working? Select all that apply.
- Nursing and healthcare30.6%
- Teaching and education22.5%
- Childcare and early childhood31.4%
- Social work and counseling25.2%
- Arts, design, and music22.2%
- Languages and the humanities23.7%
- Skilled trades and construction18.2%
- Technology and engineering20.6%
- Finance and banking21.2%
- I would not feel out of place in any of these fields12.1%
- Unsure6.2%
Trade Job Desire
Which of the following comes closest to how you think about working in a skilled trade?
- It is something I would want for myself31.1%
- It is something I would take if I had to, but not what I want35.2%
- It is not for me14.8%
- I already work in a skilled trade12.5%
- Unsure6.4%
Connection6 questions
Turn To First
When something goes seriously wrong in your life, who do you turn to first?
- My mother19.6%
- My father11.1%
- Another family member8.6%
- My spouse or partner14.8%
- A friend my own age10.3%
- A mentor, coach, or teacher3.1%
- A religious leader2.1%
- A therapist or counselor1.9%
- An online community or forum2.9%
- AI, like ChatGPT7.1%
- No one, I handle it on my own14.8%
- Unsure3.6%
Close Support Count
How many people in your life could you call at two o'clock in the morning if you really needed help?
- None10.3%
- One19.1%
- Two or three49.3%
- Four or more15.4%
- Unsure5.9%
Friendship Formation
Thinking about the men you're closest to, how did those friendships mostly get built?
- By talking openly about personal things18.8%
- Over time, by getting to know each other while doing things together38.5%
- Both about equally28.7%
- I don't really have close male friendships10.2%
- Unsure3.7%
Authority Figures
Think about the people who have held authority over you across your whole life so far, at home, in school, in sports, and at work. Have those people been mostly men, mostly women, or an even mix?
- Almost all men6.4%
- Mostly men20.6%
- An even mix of men and women50.2%
- Mostly women12.3%
- Almost all women3.9%
- Unsure6.6%
Mentorship Presence
Is there a man in your life, other than a family member you live with, who has taken a real interest in how you turn out?
- Yes, and I am in regular contact with him27%
- Yes, but we are not in regular contact26.2%
- No, and I wish there were16.9%
- No, and I do not feel I need one20.9%
- Unsure8.9%
Male Spaces
Is there anywhere in your life where you spend time around mostly other men? Select all that apply.
- School19.1%
- Work45.5%
- Sports or the gym38.1%
- Church or religious group16.2%
- A club or organization15.9%
- Nowhere really21.3%
Belonging9 questions
Organization Impact
Have you ever been part of an organization that made a real difference in your life?
- Yes46%
- No44.7%
- Unsure9.3%
Organization Type
What kind of organization made a real difference in your life? If more than one, pick the one that mattered most.
- A sports team or athletic club17.9%
- A college fraternity3.8%
- A church or religious group24.5%
- Scouting or another youth program5.7%
- The military3.6%
- A job, apprenticeship, or trade program16.5%
- A school club or academic organization10.5%
- A volunteer or service organization11.3%
- Something else6.2%
Fraternity Membership
Are you or have you ever been a member of a college or university-affiliated fraternity?
- Yes, I am currently a member8.1%
- Yes, I was previously a member16.5%
- No, but I would consider becoming a member28.2%
- No, I have never been a member and would not consider it42.1%
- Unsure5.1%
Faith Talk
How often do you and your male friends talk about faith, religion, or spirituality?
- Often19.3%
- Sometimes36.4%
- Rarely24.9%
- Never12.5%
- I don't have close male friends7%
Faith Formation Source
When you want to learn more about faith or religion, where do you usually go?
- Church or a religious leader29.1%
- Family26.8%
- Books or reading on my own20.8%
- Social media18.1%
- Podcasts or YouTube17.9%
- Friends16.3%
- Somewhere else5%
- I don't look for this15%
Rules Work For Me
Do you feel the rules in this country are set up to work for young men like you, or against young men like you?
- Definitely for someone like me15.2%
- Mostly for someone like me31.4%
- Mostly against someone like me27.6%
- Definitely against someone like me15.3%
- Unsure10.6%
Worth Investing In
Do you think most Americans see young men as people worth investing in or as a problem to be managed?
- People worth investing in46%
- A problem to be managed39.8%
- Unsure14.3%
Expectations Of Men
What do you think most women your age expect from young men today? Select all that apply.
- Make good money57.9%
- Be able to protect and take care of them43.9%
- Be fun to be around40.5%
- Be ambitious and driven39.1%
- Open up about their feelings33%
- Step back so women have more opportunity27.1%
- Split things fifty-fifty21.9%
- Unsure6.2%
Stand Out Or Fit In
Which is more important to you personally, standing out or fitting in?
- Standing out is much more important17.8%
- Standing out is somewhat more important34.2%
- Fitting in is somewhat more important25.8%
- Fitting in is much more important10.7%
- Unsure11.5%
Family2 questions
Family Trajectory
Thinking about where your life is headed, which of the following best describes you?
- I want to get married and I'm confident I will30.4%
- I want to get married but I don't see it happening for me24.5%
- I'm not sure whether I want to get married19.5%
- Getting married isn't something I want11.4%
- I'm already married8.9%
- Unsure5.3%
Children Plans
Which of the following comes closest to how you think about having children?
- It is something I want for myself34.7%
- It is something I feel obligated to do15.1%
- It is not something I plan on26.8%
- I already have children14%
- Unsure9.4%
News1 question
News Source
What are your primary sources for news? Select up to three options.
- YouTube46.5%
- TikTok29%
- Twitter / X26.8%
- Facebook22.2%
- National broadcast television news (i.e. NBC, ABC, CBS)17.9%
- Cable news (i.e. Fox News, MS NOW, CNN)17.7%
- News media websites16.9%
- Streaming app(s)13.6%
- Local broadcast television news11.6%
- Podcasts10.6%
- Newspaper7.9%
- Talk radio5%
- Other websites6.1%
- Unsure3.8%
Using the data
Terms
Quote any figure with credit to the Symposium on Young American Men and a link to its page. Do not alter or redistribute the data.
About this data
Method and provenance
Source
The Lafayette Company, Young American Men Survey 2026. Fielded by Cygnal, September 15–18, 2026. n=800 registered voters, men aged 18 to 30, margin of error ±3.46%.
Coverage
All 39 questions are published above, in full.
Terms
© 2026 The Lafayette Company. Quote with credit and a link. Do not alter or redistribute. Cite as "Symposium on Young American Men, Young American Men Survey 2026, youngamericanmen.com/data/2026".
Last year
The 2025 survey asked a different question set of 1,000 men aged 16 to 28 from the general population. This wave samples registered voters aged 18 to 30. A figure that appears in both years is not a trend.